
Methodology
How we measure
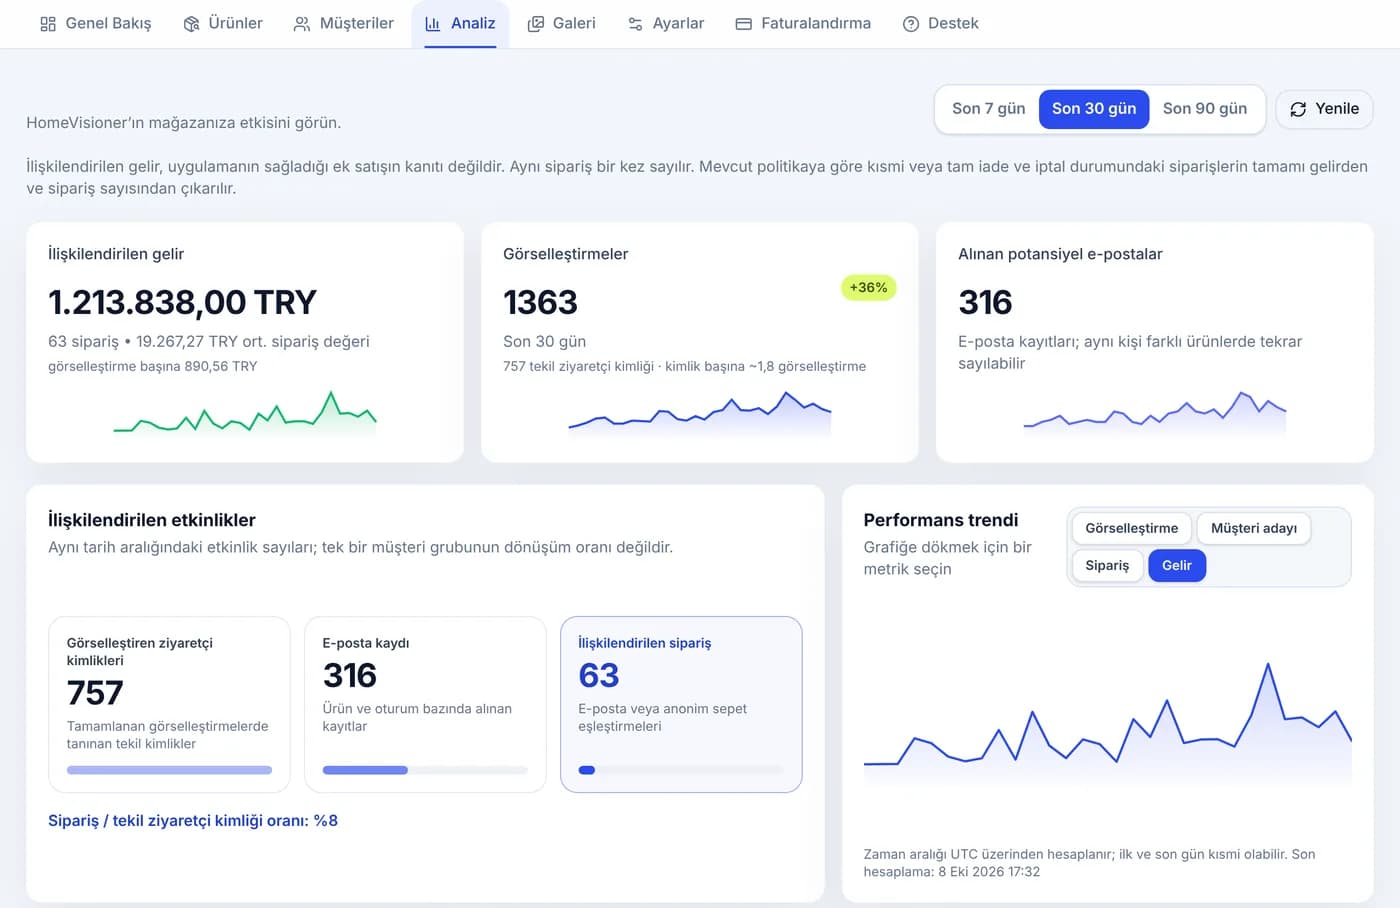
What HomeVisioner counts as a visualization, a lead, an attributed order and attributed revenue — and what these numbers do not say. The definitions apply to the analytics page in your Shopify or ikas admin and to the network figures on our home page.
Visualization
Definition
A visualization is a completed AI preview: a shopper uploads a photo of their room in the widget on your product page, and HomeVisioner returns the finished image with your product in it.
- It counts only once the result image is ready. Its date is the moment the shopper started the preview.
- Failed attempts are not counted as visualizations and do not use your quota. The ikas admin lists them separately as failed.
- Every new attempt is its own visualization: a shopper who tries the same product twice counts twice. A technical retry of the same request counts once.
- On the analytics page you pick the period: the last 7, 30 or 90 days.
Lead
Definition
A lead is an email address a shopper typed into the widget themselves — usually to unlock more previews.
- After a number of free previews that you set, the widget asks for an email address. You can turn this off. Entering one is voluntary; a shopper who doesn’t keeps the previews allowed up to that point.
- A shopper who asks to be notified when previews are back (once your store’s quota is used up) also leaves a lead. It is stored with its own source.
- Consent to marketing emails is a separate checkbox that is not pre-ticked. We store whether it was ticked. Having a customer account in the store is not consent.
- What is stored: the email address, the product (ID and title), an anonymous visitor ID of the browser, the marketing consent (yes/no), the language and the time. No name, no address.
How the analytics page counts leads:
Shopify
- Unique email addresses in the chosen period: the same address counts once, even across several products.
- If the shopper is logged in to the store, their Shopify customer ID is stored as well.
ikas
- Entries in the chosen period: one per email address, product and visitor. The same person can count again on another product.
- If the shopper already has a cart, its ID is stored so that a later order can be recognised.
Attributed order
Definition
An order is attributed to HomeVisioner when it was placed after a visualization or a lead by the same shopper in the same store — recognised in one of the ways below.
- The visualization or lead must come before the order.
- The ways are checked in a fixed order and the most reliable one that matches wins. Each order counts once, even when several ways match.
- The order does not have to contain the visualized product. When it does, the product table credits the order to that product.
The ways, per platform, in the order they are checked:
Shopify
- 1Cart note: after each completed visualization the widget notes the product and the visualization on the shopper’s cart. An order placed from that cart is attributed; there is no separate time limit for this one.
- 2Visitor ID: once the shopper has used the widget, their cart carries an anonymous visitor ID. It is matched against visualizations and leads from the 7 days before the order.
- 3Customer account: the order’s Shopify customer ID matches a logged-in shopper who visualized or left their email in the 7 days before.
- 4Email: the order’s email address matches a lead from the 7 days before; a lead on the ordered product takes precedence.
Shopify reports each new order immediately; a regular reconciliation picks up any order that was missed.
ikas
- 1Cart: the order’s ikas cart ID matches the cart in which a visualization was completed or a lead was captured — at most 30 days before the order.
- 2Email: the order’s email address matches a lead from the 7 days before; a lead on the ordered product takes precedence.
HomeVisioner reads the orders from ikas regularly, at most every 15 minutes.
Attributed revenue
Definition
Attributed revenue is the sum of the order totals of all attributed orders in the chosen period.
- It is the order’s full total as the platform reports it — not only the price of the visualized product.
- Each order counts once, even when several of its products were visualized.
- Revenue per visualization is attributed revenue divided by the visualizations of the same period.
What happens with currencies, cancellations and refunds:
Shopify
- In your store’s currency, as Shopify reports it.
- The amount at the time of the order counts. Later refunds or cancellations are not deducted at present.
ikas
- Converted to your store’s currency at the rate ikas stores with the order. Orders without a usable rate are shown separately in their own currency.
- Orders that are cancelled or refunded, fully or in part, are removed entirely from revenue and the order count. Their status is checked again for orders from the last 90 days.
What attribution is not
Definition
Attribution shows a sequence in time: an order followed a visualization. It does not show that the visualization caused the order.
- Correlation, not causation: some of these orders would have happened without a visualization. Shoppers who visualize a product are often more ready to buy to begin with.
- We make no claim of uplift. A comparison with a control group that did not visualize does not exist yet; we will publish one only once it is solid.
- Rates such as “orders per visualization” are based on visualizations, not on store visitors or ad clicks. They are not comparable with advertising conversion rates.
- Season, campaigns, price changes and stock levels all move the numbers, so compare periods with care.
The network figures on the home page
Definition
The home page shows totals across all stores using HomeVisioner on Shopify and ikas, since June 2026. They are lower bounds: “7,700+” means at least 7,700.
- Visualizations: completed visualizations as defined above. The share “completed successfully” is completed divided by completed plus failed.
- Leads: email addresses left across all stores. The same person can appear in several stores or on several products — this is not a count of unique people.
- Attributed orders: orders under the rules above, each counted once.
- Attributed cart value: the sum of those orders’ totals, converted to US dollars at approximate rates and rounded down.
- The “about 5%” rate is the number of attributed orders divided by the number of visualizations.
- The figures are updated by hand and anonymised: no single store can be identified. Between updates the real totals are higher.
Retention
Definition
Room photos and generated previews are deleted automatically 30 days after they were created — on every platform.
- The gallery in your Shopify or ikas admin shows the visualizations of the last 15 days. After that the files remain until they are deleted at 30 days, but are no longer shown.
- Deletion applies to the image files only. The counts — visualizations, leads, orders — are kept, so your analytics stays complete.
See these numbers for your own store
HomeVisioner runs on Shopify and ikas. You find these metrics on the analytics page in your admin.
A question about measurement? Write to us